Naviam Cloud Dashboard
The Naviam Cloud Dashboard delivers powerful insight into your Maximo infrastructure through a single, centralized interface. Monitor system health, analyze application logs, detect anomalies before they escalate, and track operational changes—all in real time. Built for Maximo environments, this dashboard offers at-a-glance indicators, searchable logs, and incident tracking that give teams complete control and transparency.
IBM Maximo® Application Suite
Why Naviam Cloud Dashboard?

Instant Health Insights
View real-time system metrics all in one location

Proactive Issue Detection
Identify potential performance bottlenecks or outages before they impact operations

Faster Troubleshooting
Advanced log filtering and search tools enable teams to quickly investigate issues and reduce MTTR

At-a-Glance Status Indicators
Color-coded indicators (Red, Orange, Yellow, Green, Purple) instantly communicate system health states

Complete Transparency
Track all change and incident records, whether scheduled or emergency, for full audit and reporting clarity

Designed for Admins & Support Teams
Purpose-built for IT, support, and operations teams managing Maximo environments at scale
Naviam Cloud Dashboard Features
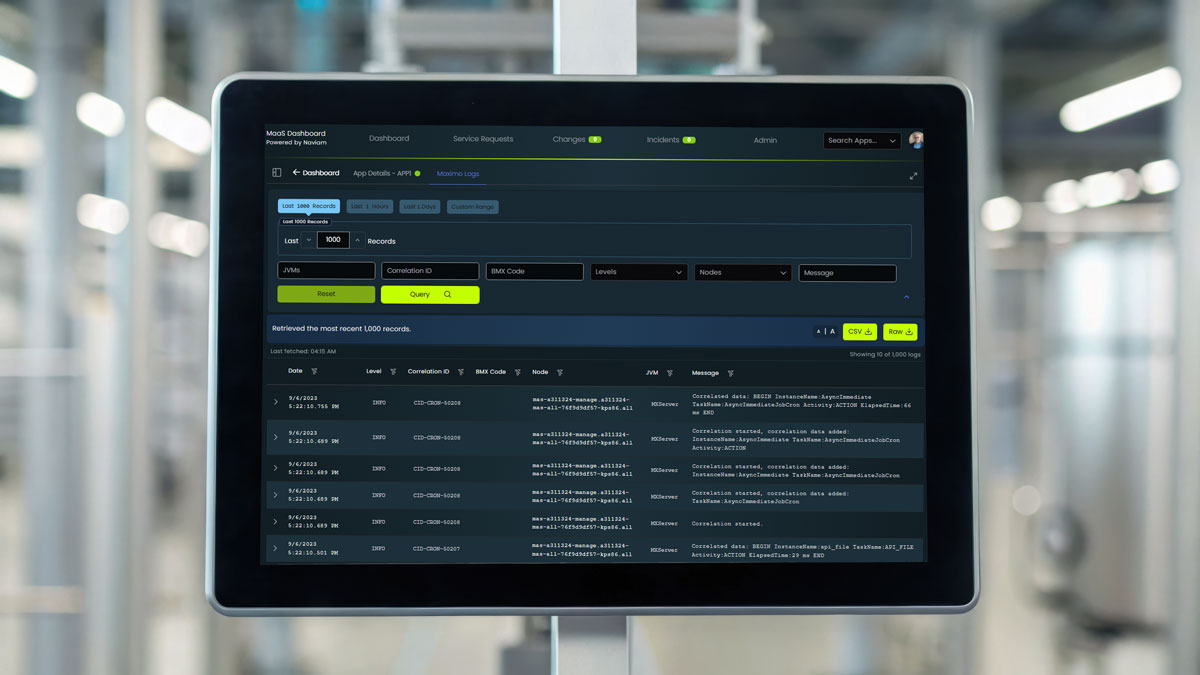
Maximo & WebSphere Log Search
Search logs by JVM, correlation ID, error codes (e.g., BMX), method, node, event type, class name, thread ID, and more
Advanced Reporting
Export log files and health monitoring data in raw or CSV format for further offline analysis or audits
Color-Coded Monitoring
Dashboard tiles visually represent system health:
Dashboard tiles visually represent system health:
- 🔴 Red – Application is down
- 🟠 Orange – Application at max usage
- 🟡 Yellow – Elevated usage
- 🟢 Green – Operating normally
- 🟣 Purple – In maintenance
Change & Incident Tracking
Review recent scheduled or emergency maintenance records with timestamped entries for transparency and accountability
Multi-View Log Access
View and compare Maximo and WebSphere logs side by side across multiple nodes or environments
Multi-Instance Monitoring
Monitor multiple Maximo environments or nodes in parallel, using filters and color-coded tiles for fast comparison across systems (e.g., DEV, TEST, PROD)
Who benefits from Naviam Cloud Dashboard?
System Admins
Quickly identify, isolate, and resolve issues before they escalate
Support Teams
Access diagnostic logs to streamline root cause analysis
IT Managers
Gain insights into long-term system behavior and usage patterns
Compliance Teams
Review change and incident history for audit preparation
Operations Teams
Monitor uptime, resource strain, and incident frequency in real time

Frequently Asked Questions
What is Naviam Cloud Dashboard?
Naviam Cloud Dashboard is a centralized monitoring and visibility solution for Maximo environments that gives teams real-time insight into system health, logs, incidents, changes, and operational status.
What can Naviam Cloud Dashboard monitor in a Maximo environment?
Naviam Cloud Dashboard can monitor Maximo and related infrastructure health, usage conditions, application status, maintenance states, incident history, change records, and logs across multiple environments or nodes.
How does Naviam Cloud Dashboard help teams troubleshoot Maximo issues faster?
It provides searchable Maximo and WebSphere logs, filtering by items such as JVM, correlation ID, error codes, methods, nodes, event types, class names, and thread IDs, helping teams isolate issues and reduce mean time to resolution.
What do the color-coded health indicators in Naviam Cloud Dashboard mean?
The dashboard uses color-coded status indicators so teams can quickly understand environment health: red for application down, orange for max usage, yellow for elevated usage, green for normal operation, and purple for maintenance.
Can Naviam Cloud Dashboard monitor multiple Maximo environments at once?
Yes. Naviam Cloud Dashboard supports multi-instance and multi-node monitoring so teams can compare development, test, and production environments in parallel from one interface.
Does Naviam Cloud Dashboard support reporting and audit readiness?
Yes. Teams can review incident and change history and export logs or monitoring data in raw or CSV format, helping with offline analysis, operational reporting, and audit preparation.
Who benefits most from Naviam Cloud Dashboard?
System administrators, support teams, IT managers, compliance teams, and operations teams benefit from faster troubleshooting, clearer visibility, incident transparency, and better control over Maximo environments.
Take Control of Your Maximo Infrastructure
Take Control of Your Maximo Infrastructure
Experience real-time Maximo monitoring and control with Naviam Cloud Dashboard.
.avif)