
Using MAS Graphical Scheduling to Forecast Preventive Maintenance with a Graphical View

A previous Naviam blog introduced you to the concept of PM forecasting and outlined the information you can view on each PM record. This blog takes the principle of forecasting one step further and shares how you can view a large volume of forecasted PM records graphically in MAS providing a broader view of the long-range workload.
Asset intensive organisations will make effective use of Maximo work management by implementing their asset maintenance strategy through the Preventive Maintenance applications in Maximo. Often the strategy is implemented but not coordinated without accounting for the operations needs and maintenance workforce.
Most organisations manage work orders efficiently including all work types - preventive, corrective, emergency - but don’t always consider the future workloads created by the maintenance strategy which can lead to missing deadlines when critical planning is missed.
Maintenance becomes more effective when planners can see what is coming before it becomes urgent. In IBM Maximo Application Suite, the Graphical Scheduling application gives maintenance teams a visual way to forecast upcoming PM work, understand resource demand, identify scheduling conflicts, and make better decisions before work orders are generated or released to the field.
When the maintenance team is required to schedule plant outages with the operations team, a long-range view of critical maintenance activities is vital.
Most maintenance organisations already use PM records to generate recurring work. The challenge is that work often becomes visible only when it is generated as a work order. By then, planners may discover that several critical jobs are due in the same week, key trades are overloaded, parts are unavailable, or plant outage windows cannot be negotiated at short notice.
PM forecasting projects future maintenance demand across a selected planning horizon. Maintenance planners review expected PM occurrences in advance and adjust schedules, resources, and materials before the workload becomes a constraint.
The Graphical Scheduling application in Manage allows planners to create schedules based on work records, assets, or location hierarchies and then view those schedules visually. The graphical view helps teams see upcoming work, resource requirements, dependencies, and potential conflicts in one planning workspace.
For preventive maintenance, this graphical view is especially powerful because forecasted PM occurrences can be reviewed as a forward-looking maintenance plan. Planners can see when PM activities are expected to fall, assess whether the workload is balanced, and determine whether changes are needed before work orders are generated.
PM forecasts are generated from the Preventive Maintenance application using the frequency rules, estimated next due dates, seasonal settings, job plan sequences, and other PM configuration details.
Forecasts can be generated manually or automated through the PM Forecast cron task and a query saved to be reused in Graphical Scheduling.
The associated crafts and labour records are also combined in a saved labour query. With their related calendars and rosters, the available resources for the Preventive maintenance program become visible in the schedule record.
The forecast does not create work orders but stores the data in separate tables. It provides planners a view of future PM demand. This is useful for medium- and long-term planning because it allows planners to understand what is likely to be due over the next month, quarter, shutdown period, or annual maintenance cycle.
Consider a network with hundreds of assets. Each asset may have monthly, quarterly, six-monthly, or annual PM requirements. Without a graphical forecast, the maintenance team may only see the workload once PM work orders are generated.
Using Graphical Scheduling, the planner can build a schedule that brings those forecasted PM activities into a single visual timeline. For example:
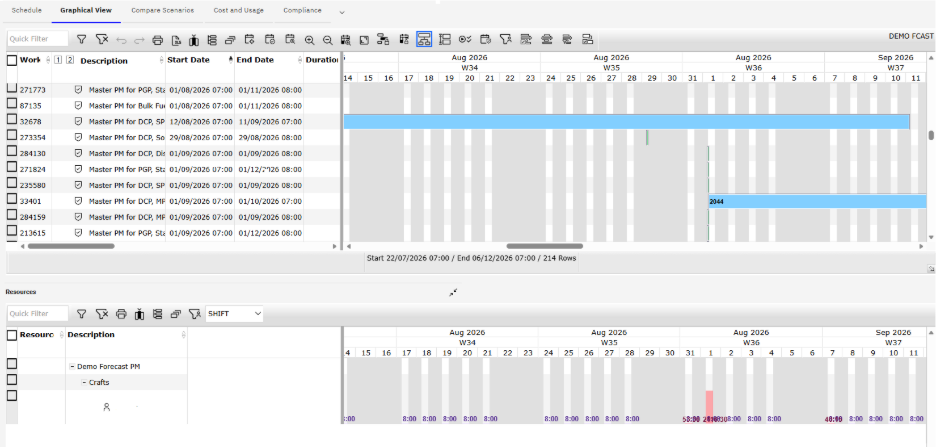
What it does: Shows graphically when PMs are due and the associated resource requirement
Excess PM requirements for available resources are displayed by a Pink bar – including recorded absences for leave.
Planners familiar with the graphical capabilities in Maximo will be able to adjust the presentation to suit their teams’ requirements.
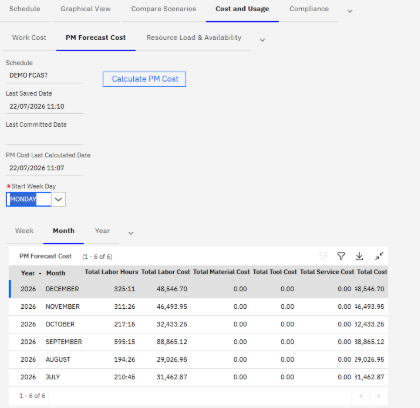
What it does: Allows Budget forecasts for all the forecasted PM’s and can be viewed and exported by week or month
What it does: Shows the weekly or monthly resource requirements compared with calculated availability, providing an effective view of resource constraints to be addressed. This example shows the PM Forecast needs more craft hours than those available.

Planners can see future PM demand before work orders are generated.
Labour, crew, and trade requirements can be assessed across the planning horizon.
Overlapping work, unavailable resources, and schedule congestion can be identified early.
PM work can be aligned with shutdowns, access windows, or traffic management windows.
Long-lead parts and service requirements can be identified before the work is due. Cranes can be booked in advance and smooth out demand.
Different schedule options can be compared before committing changes.
PM forecasting can be affected when meter-based PMs are used, as the next due dates are at the mercy of the meter reading program and dates will move.
PM’s to be generated using the Use Last Work Order's Start Date to Calculate Next Due Date? Slider off will only trigger after completion so some may be missed – check the PM record settings.
PM Workorders, being Cancelled, do not alert a PM to move to the next cycle count and are not included in a future forecast, leaving the PM hanging.
PM’s, which become workorders, lose that record in the forecast as the focus has now shifted to managing the workorders instead.
There is a limit on the number of records a graphical application can view, so be mindful of the selection criteria to keep the forecast volume to a manageable number.
A mature PM forecasting process is not just a technical configuration. It is a planning discipline. The best organisations use the graphical schedule as a regular planning forum where maintenance, operations, materials, and supervision review upcoming demand together. The schedule becomes a shared visual plan rather than a static list of work orders.
When used well, Graphical Scheduling supports better maintenance reliability by helping teams move from reactive PM generation to proactive capacity planning. It gives planners the ability to see future demand, test schedule options, protect critical assets, and ensure that field teams receive work that is realistic, prepared, and executable.
MAS Graphical Scheduling turns PM forecasting into a practical planning conversation. The Scheduling applications are included with your MAS license but will consume some APP points when deployed to the planning and scheduling team members.
Naviam can provide your organisation with training and guidance on setting up and improving long range efficiency through Graphical PM forecasting. Should you require more information, please reach out to your local Naviam team.

Discover everything you need to know to modernize your asset management strategy.
Inside, you’ll learn:


ActiveG, BPD Zenith, EAM Swiss, InterPro Solutions, Lexco, Peacock Engineering, Projetech, Sharptree, and ZNAPZ have united under one brand: Naviam.
You’ll be redirected to the most relevant page at Naviam.io in a few seconds — or you can
go now.



.avif)